The Two Formulas
Cap Rate     = NOI ÷ Purchase Price
Cash-on-Cash = (NOI − Annual Debt Service) ÷ Total Cash Invested
Both start from the same NOI: rent after vacancy, minus operating expenses, before any loan payment. The difference is what happens next. Cap rate divides NOI by the whole price. Cash-on-cash first subtracts the loan payment, then divides what's left by the cash the buyer put in: down payment, closing costs, and any rehab before the first lease.
| Cap rate | Cash-on-cash | |
|---|---|---|
| Question | What does the building yield on its price? | What does my cash earn this year? |
| Numerator | NOI | NOI minus debt service |
| Denominator | Price | Cash invested |
| Sees the loan? | No | Yes |
| Same for every buyer? | Yes | No |
The Duplex, Both Ways
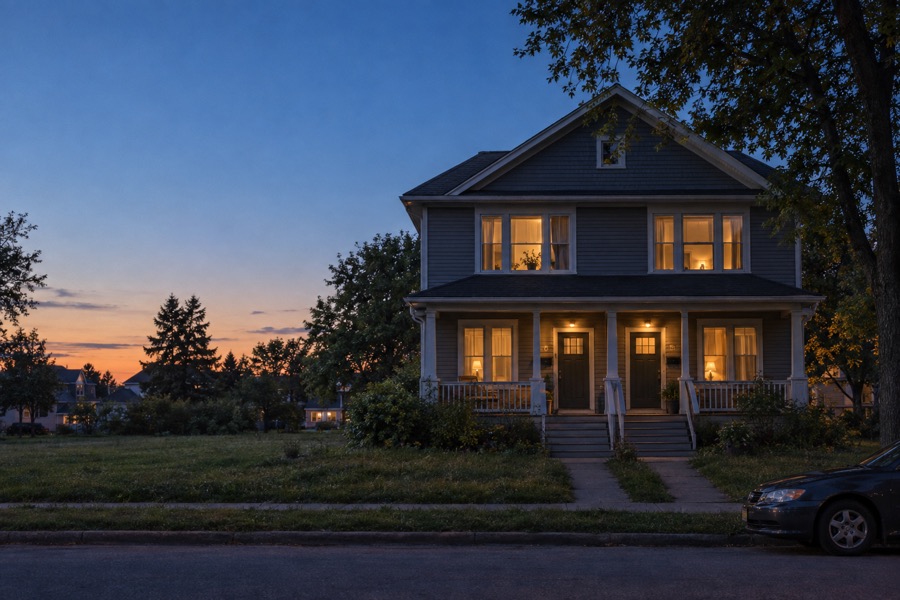
I run the same $425,000 duplex across this site so the numbers agree wherever a reader lands. It rents for $3,800 a month, and after 5% vacancy and $17,100 of operating expenses, NOI is $26,220.
Cap rate = $26,220 ÷ $425,000 = 6.2%
Every buyer of this building computes 6.2%. Now finance it: 20% down ($85,000), $12,000 of closing costs, and a $340,000 loan at 7% over 30 years, which costs $2,262.03 a month or $27,144 a year.
Cash flow    = $26,220 − $27,144 = −$924
Cash-on-cash = −$924 ÷ $97,000   = −1.0%
The building earns 6.2%. The buyer's $97,000 earns −1.0%. Both numbers are correct, and the gap between them is entirely the loan.
Same Building, Different Buyers
Because cap rate ignores financing, it stays fixed while cash-on-cash moves with every change in the loan. Four buyers of the duplex at 7%, each paying the same $12,000 of closing costs:
| Down payment | Cash invested | Cash flow | Cap rate | Cash-on-cash |
|---|---|---|---|---|
| 20% | $97,000 | −$924 | 6.2% | −1.0% |
| 30% | $139,500 | $2,469 | 6.2% | 1.8% |
| 50% | $224,500 | $9,255 | 6.2% | 4.1% |
| All cash | $437,000 | $26,220 | 6.2% | 6.0% |
At all cash the two metrics nearly converge. The remaining gap is the closing costs, which sit in the cash-on-cash denominator and not in the cap rate's. At every other row, the distance between them is a measure of what the debt does to the owner's return.
Why They Diverge: The Loan Constant
The relationship between the two metrics comes down to one comparison. The loan constant is annual debt service divided by the loan amount, the cost per borrowed dollar including principal.
Loan constant = $27,144 ÷ $340,000 = 7.98%
The building earns 6.2 cents per dollar of price. The loan costs 7.98 cents per borrowed dollar. Every financed dollar costs more than it earns, so the more of the price is financed, the lower the return on the buyer's cash. That is negative leverage.
When the constant falls below the building's yield, the relationship reverses. The same $340,000 at 4% over 30 years has a 5.73% constant. Cash flow becomes $6,741 and cash-on-cash at 20% down is 6.9%, above the cap rate. That is positive leverage: debt raising the return on equity.
| Rate (20% down) | Loan constant | Cap rate | Cash-on-cash |
|---|---|---|---|
| 4.0% | 5.73% | 6.2% | 6.9% |
| 5.0% | 6.44% | 6.2% | 4.5% |
| 6.0% | 7.19% | 6.2% | 1.8% |
| 7.0% | 7.98% | 6.2% | −1.0% |
| 8.0% | 8.81% | 6.2% | −3.8% |
The trap sits in the 6% row. A 6% interest rate is below the 6.2% cap rate, which looks like positive leverage. The constant is 7.19%, because a 30-year payment includes principal, and principal leaves the owner's account every month even though it builds equity. The comparison that predicts which way leverage cuts is cap rate against loan constant, not cap rate against interest rate.
When Cap Rate Is the Right Tool
Comparing buildings. Cap rate strips the buyer out of the math, so two properties can be compared on income per dollar of price regardless of who is financing them or how. The duplex at 6.2% buys more current income per dollar than a building at 5.0%, before anyone asks what either costs to borrow against.
Reading market pricing. Cap rate is what the market pays for a dollar of income, and published benchmarks from CBRE and Marcus & Millichap are all computed before debt. Only an unlevered number can be held against them. Current ranges are in What Is a Good Cap Rate?
Valuing income. Running the formula backward, Value = NOI ÷ Cap Rate, turns a market cap rate into a price. At a 6.2% cap, the duplex's $26,220 supports about $422,900. At 5.0%, it supports $524,400. The cap rate guide works through that sensitivity.
Checking a seller's number. Because cap rate uses only NOI and price, it's quick to recompute from the trailing twelve months of actual rent and expenses and compare against the listing.
When Cash-on-Cash Is the Right Tool
Deciding whether a specific purchase cash flows. Cap rate can't say. Cash-on-cash can, and on the duplex it says the owner funds $924 a year at 20% down and 7%.
Choosing a financing structure. The down payment table above is a cash-on-cash question. Every row has the same cap rate and a different answer.
Finding the price that works. Hold the loan terms and ask what price produces zero cash flow. At 20% down and 7%, the duplex breaks even at about $410,500, a 6.4% cap. At the $425,000 asking price, it breaks even with rent of about $3,881 a month, $81 more than today.
Comparing against other uses of the cash. The owner's alternative to buying is doing something else with $97,000. Cash-on-cash is the return on that specific amount, so it's the figure that belongs in that comparison, with the caveat that it leaves out principal paydown and appreciation.
Leverage Magnifies Every Assumption
Cash-on-cash reacts to a change in NOI far more than cap rate does, because the debt service stays fixed while the income moves. On the duplex at 20% down and 7%:
| Change | Cap rate | Cash-on-cash |
|---|---|---|
| Base case | 6.2% | −1.0% |
| Rent 10% lower | 5.2% | −5.4% |
| Vacancy at 10% | 5.6% | −3.3% |
| Expenses 10% higher | 5.8% | −2.7% |
A 10% rent miss costs the cap rate about one point and costs cash-on-cash about four and a half. An optimistic assumption that looks minor in the cap rate is large in the cash-on-cash, and the more leverage on the deal, the larger the multiplier.
Common Errors
Subtracting the mortgage inside NOI. That turns cap rate into a financing number that can't be compared against any published benchmark or any other building.
Dividing NOI by the down payment. That produces a number that looks like cash-on-cash and overstates it by the full debt service. NOI is before the loan. Cash-on-cash is after.
Leaving closing costs out of cash invested. On the duplex, the denominator drops from $97,000 to $85,000, and the return reads −1.1% instead of −1.0%. On a positive deal the same omission inflates the result.
Comparing cash-on-cash across different leverage. A higher cash-on-cash on one deal can come from a thinner down payment rather than a better building. Cap rate is the comparison that holds financing constant.
Neither One Sees the Whole Return
Both metrics are single-year and pre-tax. Neither counts principal paydown, appreciation, or depreciation. On the duplex, year one of the loan retires $3,454 of principal, which cash-on-cash treats as spent. Adding it back gives (−$924 + $3,454) ÷ $97,000 = 2.6% before any appreciation. The ROI guide builds the full first-year return, and IRR puts a holding period on it. Whether the loan can be carried at all is a DSCR question: $26,220 ÷ $27,144 = 0.97 on the duplex.
Quick Reference
| Question | Metric |
|---|---|
| Is the asking price in line with the market? | Cap rate |
| Which of two buildings yields more on its price? | Cap rate |
| What is this NOI worth at a market cap rate? | Cap rate |
| Does this purchase cash flow with my loan? | Cash-on-cash |
| How much should I put down? | Cash-on-cash |
| Does the debt raise or lower my return? | Both, via the loan constant |
FAQ
Which is better, cap rate or cash-on-cash?
Neither. They answer different questions. Cap rate describes the building and is the same for every buyer. Cash-on-cash describes one buyer's financed position. On the duplex, 6.2% and −1.0% are both correct.
Why is my cash-on-cash lower than the cap rate?
Because the loan constant is higher than the building's yield. On the duplex, the loan costs 7.98% of its balance a year against a 6.2% cap rate, so every borrowed dollar lowers the return.
When are cap rate and cash-on-cash the same?
On an all-cash purchase with no closing costs. With the duplex's $12,000 of closing costs, all cash returns 6.0% against a 6.2% cap rate.
Does a lower interest rate always make cash-on-cash higher than cap rate?
No. The rate has to push the loan constant below the building's yield. On a 30-year loan, a 6% rate still carries a 7.19% constant, above the duplex's 6.2%.
Do cap rate benchmarks apply to cash-on-cash?
No. Published cap rate surveys are unlevered, so they only compare to cap rate. Cash-on-cash depends on each buyer's loan, and there's no market-wide survey of it.
Related Reading
- Cap Rate Explained: the formula, ranges by property type, and what cap rate leaves out
- Cash-on-Cash Return Guide: the denominator in detail and how leverage changes the result
- What Is a Good Cap Rate?: published benchmark ranges by sector and class
- Net Operating Income Explained: the number both metrics start from
- Break-Even Occupancy Analysis: how much vacancy a deal can absorb
Keep reading
- 1031 Exchange Rules: Timelines, Like-Kind Property and What Gets DeferredHow a 1031 exchange defers capital gains on a property sale: the like-kind and equal-value rules, the 45 and 180 day deadlines, and where exchanges fail.
- Break-Even Occupancy: How Empty a Rental Can Get Before It Loses MoneyThe break-even occupancy and break-even rent formulas for a rental property, worked with real numbers, and what the result says about risk and financing.
- The BRRRR Method: Buy, Rehab, Rent, Refinance, Repeat, With the MathHow the BRRRR method works step by step, how much cash the refinance actually returns, and where the numbers break when the appraisal comes in low.